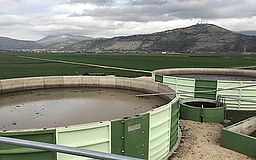
In the overall cost analysis of a chemical additives company from northern Germany, energy costs were a major cost factor at almost 40%. Combined with an anticipated annual price increase of about 5%, it was time to act.
The world is facing a turning point in the energy policy. Since the industrialization 150 years ago, the industry depends on basic commodities, such as oil and gas. Reversing this dependence is the greatest and most difficult task that science and politics face in the future. Utilities reassure the industrialized countries with the promise: The supply of oil and gas is still secure for at least another 50 years. At the same time, the debate concerning nuclear energy is experiencing a renaissance. However, uranium cannot break down indefinitely. According to current projections, the deposits will be exhausted in approximately 35 years. Moreover, the safe storage of highly radioactive waste is still unclear to this day.
Renewable energies, such as photovoltaics, solar-thermal energy conversion, geothermal prospecting, biogas and wind provide hope. However, these do not have the efficiency needed to compete with the cheaper basic raw materials at this time. If renewable energy should become a serious alternative, energy consumption has to be dramatically reduced. Should this effort succeed, it would have an immediate dual effect: Lower energy requirement makes renewable energy affordable for the consumer, and every measure by itself reduces CO2 emissions.
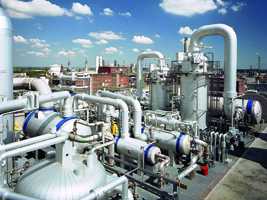
Typical energy costs in chemical plants
However, until alternative energy sources are economically viable, conventionally produced energy will initially become more expensive, since an increasingly greater expense is necessary for the extraction and production. A lecture at the VDI / GMA Conference in Baden-Baden last year, stated: The average energy of a chemical production facility amounts to an average of 37% of the total cost. The energy costs, as determined in the overall cost analysis of a medium-sized chemical company, are therefore a typical value at up to 40%, rather than an isolated case.
Measurements create Transparency
"In the beginning was the measurement." This old phrase from the process automation is still valid. In order to understand and interpret processes, a possibly accurate and continuous monitoring of product flows is required. Known measuring methods, such as pressure, filling level, temperature, flow and analysis measuring transducers are enlisted. In order to be able to reduce energy costs in production, measurements are also required to make the energy consumption transparent. However, before the energy consumption can be affected, the energy flows must first be analyzed in detail. It was therefore important for the medium-sized chemical company in northern Germany to precisely capture the power consumption of vulnerable areas. It searched for a solution that can easily be integrated and pay for itself within a manageable framework. The choice fell on the Wago-I/O-SYSTEM. It has convinced the company, because, apart from the control functionality, is contains a variety of components, including one for energy monitoring. ((Figure 1))
The 3-phase power measurement module 750-493 was therefore an argument for the Wago I/O-SYSTEM. It allows a detailed measurement of electrical volumes in a three-phase supply network. The voltage of the three phases and zero can be measured at the terminal by directly wiring the individual lines.
However, it records the current and voltage values of all three phases by six analog / digital converters within a time frame of 16 microseconds. The currents are delivered by a simple current transformer for a current measurement. The measured current and voltage values are shown in root-mean-square values by the terminal and calculates the effective power (P), the energy consumption (W) and the power factor (cos φ) for each phase. The apparent power (S) and the phase shift (φ) can be derived from these values. In addition to these energy data, it also records the energy peaks occurring over a definable period and internally sums up the energy consumption. Various operating modes, or shifted peak times can therefore be already assessed after one production cycle. ((Figure 2))
Using these components, small intelligent "I/O measurement nodes" developed in selected areas in the northern German chemical plant, which capture the consumption with this power measurement terminal. Each node is provided in the field with an Ethernet controller, which is networked with other controllers. The power consumption of each node is also visible via the network from the intranet.
Measurements result in Measures
Concrete actions followed, after the energy consumption was recorded and an analysis of the measurements was determined and the cost per consumer and time period were calculated. First, the chemical company negotiated with local suppliers. They laid down electricity rates for various time periods during the day and at night. In order to use the electricity rates optimally, the intelligent measurement nodes also had to assume turning the plant components on and off. This not only depends on favorable electricity rates, but also on the feasibility of the operation. However, there were actually pumps and compressors that were not operated continuously around the clock. Here, the optimization depending on the electricity rates and time was possible. This function was realized by decem-energy controlling. It assumes overriding management functions and can therefore objectively activate or deactivate or plant parts.
Summary
Only an accurate recording of the power consumption and the determination of the timeframe brought clarity of the situation. Energy guzzlers could thereby be identified. "I / O-measurement nodes, linked by an Ethernet network and some equipped with small on-site panels, were able to precisely analyze the energy flow. The energy controlling tool of the Berlin firm Dezem assumed the monitoring, analysis, billing and issuance of control commands of the plant. Based on the calculated values, the company negotiated the best rate with the energy supplier. The entire energy requirement was reduced by actively activating and deactivating the consumers in reference to the rates. This represents a reduction of energy costs to below 25% in the total cost analysis. The investments in this project therefore paid back over a period of approximately two years.
Transparent consumption,
better electricity tarifs
- by WAGO Kontakttechnik GmbH & Co. KG
- May 14, 2010
- 29422 views
